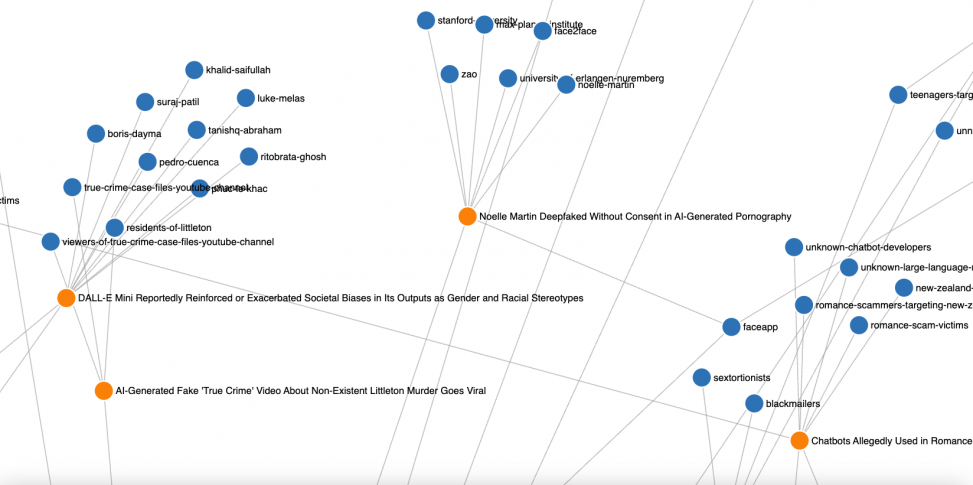
Preliminary web-based network graph – work in progress-
https://ozgur.onal.info/AI-incidents/
Although the number of AI incidents is increasing, their trends are still hidden by noise. This research turns 3,200+ connected entities and more than 1,000 real-world AI failures into an interactive network map, revealing relational blind spots and hidden systemic hazards. It illustrates the ways in which harm spreads across actors, time, and domains through computational drawing and generative visualization. It’s more than simply a dashboard; it’s an investigative tool that helps engineers, researchers, and politicians address the practical effects of artificial intelligence.
Project Overview
An AI incident refers to an event where an AI system behaves unexpectedly, causes harm, or leads to negative consequences. This can range from a simple malfunction to serious issues such as biased decision-making or data breaches. The term covers a wide variety of problems that can arise when artificial intelligence is used in real-world situations. some general categories of AI incidents are Performance Failures, Bias and Discrimination, Security Breaches, Ethical Concerns, Autonomous Decisions, Lack of Transparency .
This proposal presents an approach that transforms a curated dataset of AI incidents (more than 1K incidents and more than 3200 Entities) into a dynamic visual experience. By employing algorithmic drawing, and particle systems, each incident is represented as a particle within a simulated space. Data attributes such as incident date, involved entities, and severity influence the particles’ position, size, color, and movement, collectively revealing patterns and temporal evolutions inherent in the dataset.
This proposal offers a novel perspective on AI incidents, transforming complex data into an immersive visual experience that resonates with contemporary societal concerns. Furthermore, exploring the use of visual approach to communicate the broader societal impact of AI incidents could help raise awareness and foster more informed discussions about AI safety and ethics. In conclusion, visual approach presents a transformative potential in the field of data analysis and communication, offering a novel and engaging lens through which to understand the complex landscape of AI incidents.
Vision
The proposal transcends traditional data visualization by offering an experiential journey into the complexities of AI incidents. Visitors navigate through an evolving landscape where the interplay of form, color, and motion invites introspection on the ethical and societal dimensions of AI technology. This approach fosters a visceral understanding of abstract data, aligning with contemporary art’s capacity to provoke thought and dialogue.
AI incidents Dataset that I am working with:
Last couple of years, I was involving with the ethical dimensions of the AI and curating a AI Incidents relational network dataset based on open source resources, which documents real-world harms (or near harms) caused by the deployment of AI systems. This database serves as a critical historical record to help learn from past experiences and mitigate future risks.
Dataset Fields:
The structured dataset includes:
Incident’s title & Date (Unique identifiers and timeline of AI-related incidents) (more than 1K)
Description (Summarized narrative of the incident)
Entities: (morethan 3K Entities who are either deploying , developing or harmed by the AI system)
- Alleged Deployer & Developer
- Harmed or Nearly Harmed Parties (Affected companies ,individuals or groups)
Example Entities:
| ENTITY | AS DEPLOYER AND DEVELOPER | AS DEPLOYER | AS DEVELOPER | HARMED BY |
| 52 Incidents | 2 Incidents | 1 Incident | 1 Incident | |
| 46 Incidents | 0 Incidents | 12 Incidents | 4 Incidents | |
| Tesla | 43 Incidents | 0 Incidents | 5 Incidents | 3 Incidents |
| OpenAI | 41 Incidents | 0 Incidents | 52 Incidents | 10 Incidents |
| Meta | 27 Incidents | 2 Incidents | 4 Incidents | 2 Incidents |
| Amazon | 23 Incidents | 2 Incidents | 3 Incidents | 3 Incidents |
| Microsoft | 21 Incidents | 1 Incident | 8 Incidents | 10 Incidents |
| Apple | 14 Incidents | 0 Incidents | 2 Incidents | 3 Incidents |
| YouTube | 14 Incidents | 0 Incidents | 0 Incidents | 0 Incidents |
Preliminary web-based network graph – work in progress https://ozgur.onal.info/AI-incidents/
One sample Incident:
Title: Facebook translates ‘good morning’ into ‘attack them’, leading to arrest
Description: Facebook’s automatic language translation software incorrectly translated an Arabic post saying “Good morning” into Hebrew saying “hurt them,” leading to the arrest of a Palestinian man in Beitar Illit, Israel.
Harmed entities: Palestinian Facebook users , Arabic-speaking Facebook users
The increasing deployment and sophistication of artificial intelligence systems have brought forth numerous benefits across various sectors. However, this progress has also been accompanied by a growing number of incidents involving AI, raising important safety and ethical concerns. Understanding the patterns and underlying factors contributing to these incidents is crucial for mitigating risks and fostering responsible AI development and deployment. Traditional data visualization techniques, while valuable, may fall short in revealing the complex, multi-dimensional relationships and abstract patterns inherent in datasets describing AI incidents. These conventional methods often rely on predefined chart types that can oversimplify or obscure intricate connections and temporal evolutions. The multifaceted nature of AI incidents, typically involving diverse stakeholders and unfolding consequences over time, necessitates more advanced and expressive visual approaches.
Generative art, a field that utilizes algorithms and computational processes to create visual outputs, presents a novel and promising approach to data visualization. By leveraging the dynamic and rule-based nature of generative techniques, complex datasets can be translated into visually engaging and potentially more insightful forms. Unlike static and predetermined traditional visualizations, visual approach can dynamically adapt and evolve based on the underlying data, potentially uncovering hidden patterns and relationships that might remain unnoticed through conventional analytical methods. This report explores the application of various generative techniques and visual design concepts to the specific challenge of revealing patterns and insights within a dataset of AI incidents, aiming to demonstrate the potential of this approach to enhance our understanding of AI safety. The generative techniques that will be examined include algorithmic drawing, L-systems, cellular automata, and particle systems, alongside relevant visual design concepts such as data mapping, color palettes, and visual hierarchy.
Comments are closed.